


Services
Providing Advanced Biological Technical Services for Researchers in Fundamental Science
Molecular Dynamics Simulation Service (Protein–Protein / Small Molecule)
Accurate Interaction Stability & Mechanism Analysis at the Atomic Level
Service Overview
ProNet Biotech offers high-precision molecular dynamics (MD) simulation services for protein–protein and protein–nucleic acid / small molecule complexes. By simulating molecular behavior under different temperature and solvent conditions, our MD platform evaluates complex stability, binding interface dynamics, and interaction mechanisms at the atomic scale—providing valuable insights for structural optimization, mechanism elucidation, and experimental validation.
Compared with static structural analysis, MD simulation dynamically tracks conformational changes, binding stability, and environmental responses—helping researchers reveal how biomolecules interact over time.
Technical Principle
Using the provided 3D structure (PDB format) of the complex as the initial model, we apply classical force fields to accurately describe interatomic interactions. The simulation dynamically tracks the trajectory of each atom, revealing detailed molecular events such as:
· Binding and dissociation processes
· Interface rearrangement
· Conformational transitions
· Key residue contributions to stability
Our simulations are performed on in-house high-performance computing (HPC) servers, ensuring fast turnaround and reproducible results.
Applications
Protein–Protein MD Simulation
· Dynamic Interaction Mechanism – Capture conformational transitions, interface stability, and binding affinity changes.
· Mutation & Stability Assessment – Evaluate the effects of point mutations on structural stability and binding strength.
· Experimental Guidance – Identify key binding residues and stability trends to support wet-lab validation (e.g., SPR, MST, BLI, ITC).
· High-Impact Publications – Provide high-quality structural visualizations to enhance manuscript figures and mechanism analysis.
Protein–Small Molecule MD Simulation
· Binding Mechanism Analysis – Monitor pocket flexibility, key interactions, and binding stability throughout the trajectory.
· Structure Optimization & SAR Studies – Evaluate residue importance and ligand modifications for improved affinity.
· Experimental Validation Support – Output RMSD, RMSF, hydrogen bond occupancy, and free energy profiles to guide in vitro validation.
· Publication-Ready Data – Deliver professional visualizations for journal submission.
Technical Workflow
Our Molecular Dynamics (MD) Simulation Workflow follows a standardized, publication-ready pipeline to ensure reproducibility, accuracy, and compatibility with leading simulation packages (e.g., AMBER, GROMACS). The process is optimized for both protein–protein and protein–small molecule complexes.
1. Data Preparation
Structure Source: Initial coordinates are obtained from the client-provided protein–protein or protein–ligand complex (PDB format).
Quality Requirements: High-resolution, complete structures are recommended, with no missing residues/atoms and proper atom naming for full compatibility.
Force Field Assignment:
Proteins: Parameterized using the AMBER ff14SB force field.
Small Molecules: Parameterized using AmberTools antechamber with AM1-BCC charges, generating standard MOL2 force field files.
System Building: Hydrogen atoms are added; the complex is solvated in a TIP3P water box (10 Å orthorhombic box) and neutralized with Na⁺/Cl⁻ counterions.
2. Simulation Pipeline
(1) Energy Minimization
Purpose: Remove steric clashes and relax initial geometry.
Method: Apply positional restraints on protein backbone; optimize water molecules and ions first.
Iterations: Up to 5,000 steps.
(2) Heating
Gradually increase system temperature from 0 K to 300 K using the Langevin thermostat.
Maintain backbone restraints to preserve protein integrity.
Duration: ~50,000 steps with a 2 fs timestep.
Optional: Temperature gradient simulations (e.g., 50°C–80°C) with independent full simulation cycles for each temperature point.
(3) Density Equilibration (NPT)
Equilibrate system density under constant pressure (1 atm) and temperature (300 K).
Continue applying backbone restraints to stabilize the protein structure.
(4) Equilibration
Gradually release or remove backbone restraints.
Duration: 100–200 ps under fixed T/P conditions to eliminate residual stress.
(5) Production Run
Unrestrained MD simulation for 50–400 ns (or as specified by the client).
Trajectory output every 10 ps for downstream analysis.
3. Trajectory Analysis
Performed using cpptraj (AMBER) and VMD for visualization:
(a) Structural Stability & Flexibility
RMSD: Quantifies structural deviation from the reference frame for the entire complex or selected components.
RMSF: Identifies flexible and stable regions at the residue/atom level.
(b) Hydrogen Bond Analysis
Identify key hydrogen bonds at the binding interface.
Measure donor–acceptor distance (<3.5 Å) and angle (<35°).
Output includes bond counts, lifetimes, and spatial distribution.
(c) Binding Free Energy & Energy Decomposition
Performed via MM/GBSA calculations.
Break down van der Waals, electrostatic, and solvation contributions.
Determine key residues or ligand moieties contributing to binding stability.
Key Advantages
High-Performance Computing – In-house HPC servers enable fast, large-scale simulations.
Expert Team – Decades of combined experience in MD simulation, structural modeling, and interaction analysis.
Publication-Grade Visuals – RMSD, RMSF, H-bond networks, binding free energy heatmaps, and 3D/2D interaction maps.
Full Experimental Validation – Seamless integration with our yeast two-hybrid, Co-IP, SPR, MST, BLI, ITC platforms for in vitro confirmation.
Customizable Parameters – Temperature gradient simulations (e.g., 50 °C–80 °C), metal ion parameterization, and special system setups.
Case Results
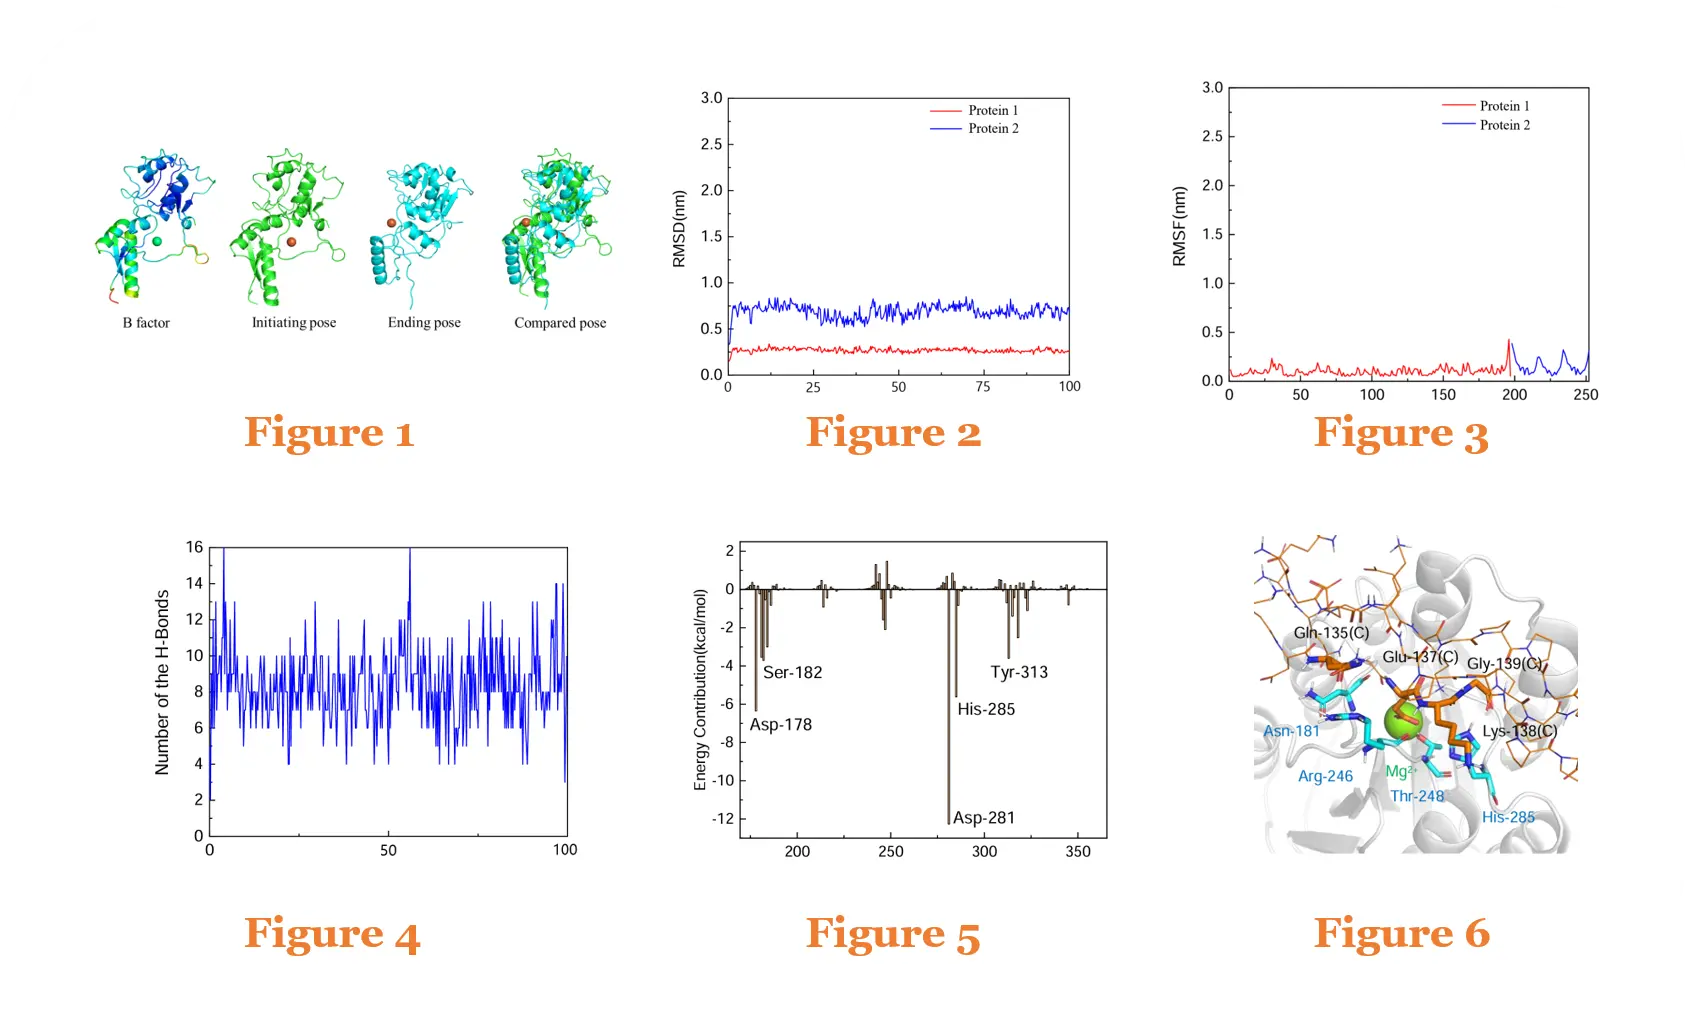
Protein–Protein Molecular Dynamics Simulation Case
Figure 1: B-factor analysis and conformational changes of the Protein1–Protein2 complex during MD simulation
Figure 2: RMSD of the Protein1–Protein2 complex over 100 ns MD simulation
Figure 3: RMSF of the Protein1–Protein2 complex over 100 ns MD simulation
Figure 4: Number of hydrogen bonds in the Protein1–Protein2 complex over 100 ns MD simulation
Figure 5: Per-residue binding free energy contributions of the Protein1–Protein2 complex over 100 ns MD simulation
Figure 6: Conformation and interactions of the Protein1–Protein2 complex after 100 ns MD simulation
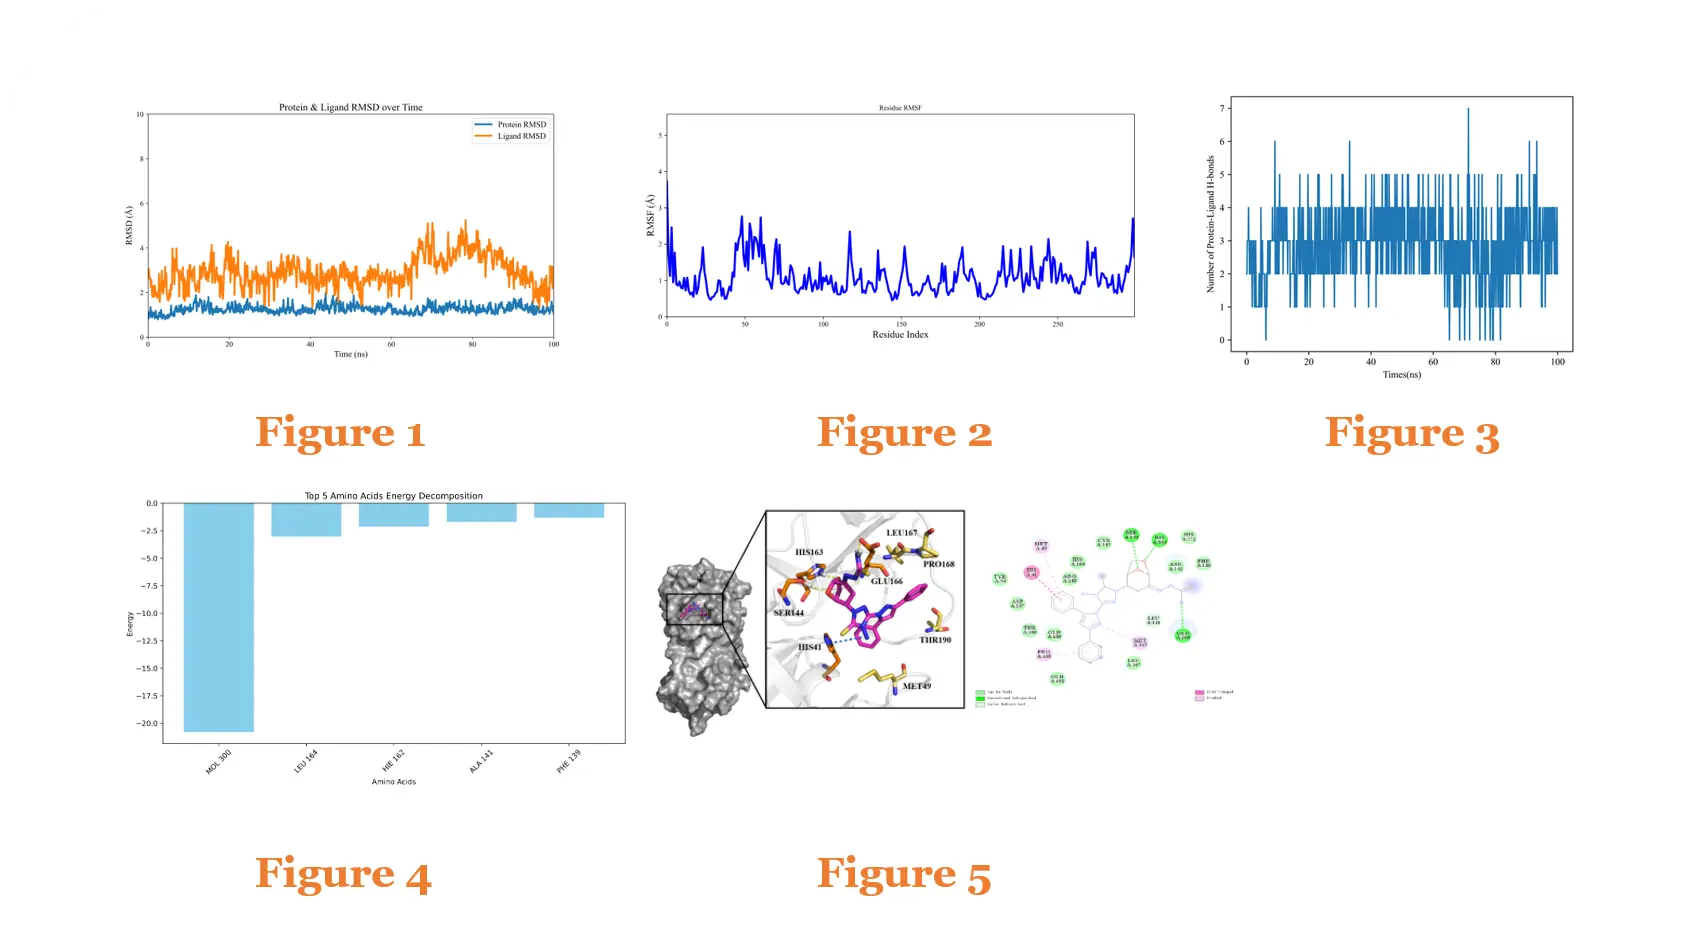
Protein–Small Molecule Molecular Dynamics Simulation Case
Figure 1: RMSD of the Protein–Ligand complex over 100 ns MD simulation
Figure 2: RMSF of the Protein–Ligand complex over 100 ns MD simulation
Figure 3: Number of hydrogen bonds in the Protein–Ligand complex over 100 ns MD simulation
Figure 4: Per-residue binding free energy contributions of the Protein–Ligand complex over 100 ns MD simulation
Figure 5: Conformation and interactions of the Protein–Ligand complex after 100 ns MD simulation
Sample Requirements
Protein–Protein: PDB file of docked complex + sequence info (≤800 aa total recommended).
Protein–Ligand: 3D ligand structure (mol2/sdf/pdb) + 2D chemical diagram.
For sequence-only cases, an AOS / molecular docking service is required prior to MD simulation.
Deliverables
Our Molecular Dynamics (MD) Simulation Service provides a complete data package suitable for both in-depth research and high-impact publication. All results are prepared in a publication-ready format with clear figures, tables, and detailed explanations.
Standard Deliverables (All Projects)
MD Simulation Trajectory Files – Full simulation trajectory in PDB/DCD format.
RMSD & RMSF Data – Quantitative plots showing structural deviation and flexibility over simulation time.
Hydrogen Bond (H-Bonds) Analysis – Count, occupancy, and lifetime of key hydrogen bonds at the binding interface.
Start vs. Final Structure Comparison – 3D visualization showing conformational changes.
Binding Free Energy Analysis – Calculated via MM/GBSA, including van der Waals, electrostatic, and solvation components.
Interaction Analysis – Identification of key residues or ligand moieties contributing to complex stability.
Protein–Protein MD Simulation Deliverables
RMSD profile of the complex over simulation time.
RMSF profile identifying flexible and stable regions.
Binding free energy calculation and residue contribution analysis.
Detailed hydrogen bond network analysis.
Start vs. final conformation comparison.
Key interface interaction mapping.
Protein–Small Molecule MD Simulation Deliverables
Hydrogen bond occupancy analysis over time.
3D Interaction Visualization – Binding mode and interaction geometry.
2D Interaction Diagram – Schematic representation of key contacts.
Binding free energy decomposition table (van der Waals, electrostatic, solvation).
Energy contribution analysis for key residues and ligand moieties.
Hydrogen bond network analysis.
RMSD and RMSF profiles for both protein and ligand.
Pricing & Turnaround
Simulation Time | Turnaround |
|---|---|
100 ns | ~15 business days |
200 ns | ~15 business days |
400 ns | ~15 business days |
* Custom pricing for larger systems, metal ion inclusion, or special requests.
Note: All services are for research use only and not for diagnostic or therapeutic purposes.
Services Workflow

Online Consultation
01
Solution Matching
02
Service Contract
03
One-Stop-Services
04
Project Report
05
Related Products
")
")
 Screening Service")

Product Inquiry
Contact Us
Tel: +86 025-85205672
Email: info@pronetbio.com
Address: Building 3C, Nanjing Xianlin Zhigu,
Qixia District, Nanjing, Jiangsu, China, 210033
Need more info?
Let's connect!