Services
Providing Advanced Biological Technical Services for Researchers in Fundamental Science
ChIP-qPCR & ChIP-seq Services
High-Sensitivity Profiling of Protein-DNA Interactions at Gene-Specific and Genome-Wide Levels
Service Overview
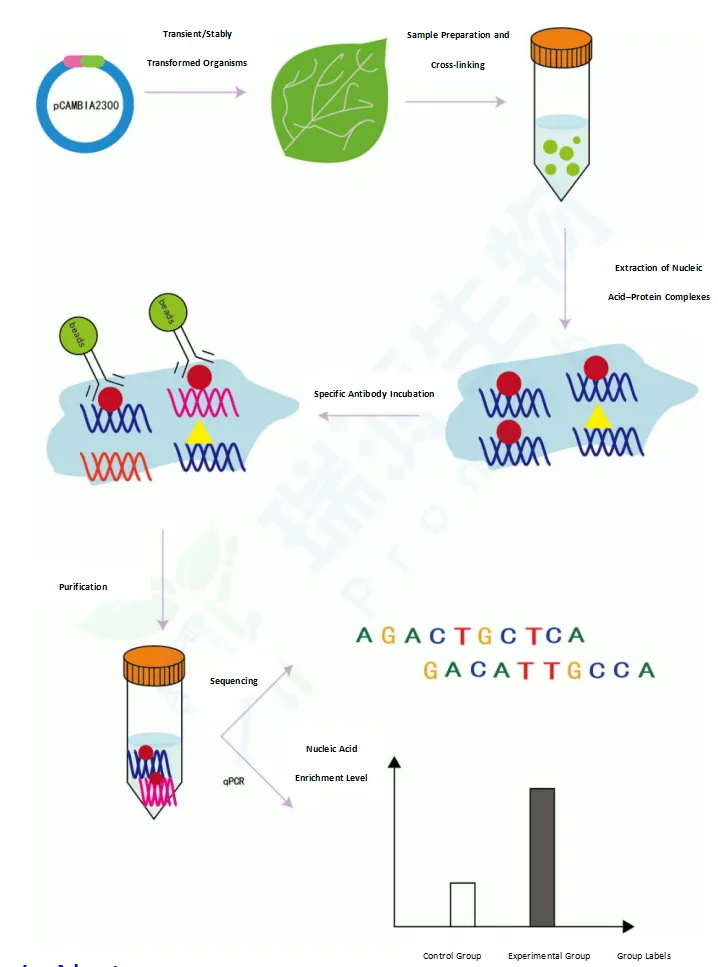
Chromatin Immunoprecipitation (ChIP) is a powerful technique used to investigate the interaction between proteins and DNA within cells. The core principle involves cross-linking proteins and DNA in chromatin using formaldehyde or other cross-linking agents. The chromatin is then sheared into smaller fragments by sonication or nuclease digestion. Specific antibodies are used to immunoprecipitate DNA fragments bound by the target protein. Finally, these fragments are analyzed using PCR, qPCR, or high-throughput sequencing technologies.
ChIP-qPCR combines highly efficient ChIP with quantitative real-time PCR (qPCR) to analyze protein–DNA interactions. This method not only reveals whether a transcription factor binds to a specific DNA region, but also allows quantitative comparison of binding affinities at different loci. It has become an essential tool for studying gene regulatory mechanisms and elucidating transcription factor functions.
ChIP-seq integrates ChIP with next-generation sequencing (NGS) to identify binding sites of histones, transcription factors, and other DNA-associated proteins across the entire genome with high sensitivity and resolution. It is particularly useful for discovering unknown DNA regions bound by the protein of interest and identifying downstream functional target genes.
Overall Service Workflow
1. Gene Cloning & Vector Construction (if required)
2. Agrobacterium-Mediated Plant Transformation
3. Protein-DNA Crosslinking & Chromatin Fragmentation
4. Chromatin Immunoprecipitation (ChIP)
5. ChIP-qPCR or ChIP-seq Analysis
6. Data Interpretation & Bioinformatics Reporting
Service Advantages
Accurate Analysis:Provides qPCR validation and high-throughput sequencing to precisely measure gene or region binding, ensuring reliable data.
High Sensitivity:Requires minimal starting DNA, enabling quantification of protein-DNA interactions genome-wide even from limited samples.
Professional Support:Combines with other techniques to deliver gene function annotation, enrichment, and motif analysis for comprehensive gene regulation insights.
Reliable Service:Technical and business support with dedicated consultants online, ensuring smooth project progress.
Service Content
Service Items | Service Content | Working Days | Deliverables |
1. Gene Synthesis / Vector Construction | ☐ Gene Synthesis (Codon Optimization) ☐ Gene Synthesis (No Codon Optimization) ☐ Vector Construction (Codon Optimization) ☐ Vector Construction (No Codon Optimization) | 15 | 1. Gene Synthesis Report 2.Sequencing Validation Report 3.E. coli DH5α/TOP10 containing the expression plasmid 4.Plant Expression Plasmid |
2.Transient Expression Transformation | A. Plant Subculture B.Agrobacterium Transformation and Identification C. Transient Transformation | 10 | 5.Positive Identification Result Image |
3.ChIP-qPCR Analysis (Optional) | A. Protein Extraction Before ChIP + Western Blot (Tissue Cross-Linking) B. ChIP Enrichment and Western Blot Detection of Bait Protein in Input Samples C. Reverse Cross-Linking and DNA Purification D. ChIP-qPCR | 20 | 6. WB and qPCR Result Images 7.Standard ChIP Experimental Report (Including Protocol and Workflow) |
4.ChIP-seq Analysis (Optional) | A. Western Blot Detection of Bait Protein in Input Samples B. ChIP Enrichment of Bait Protein and Its Bound DNA Fragments (Two Groups: Experimental and Control)
| 20 | 8.Western Blot Image of Bait Protein 9. ChIP Experimental Report |
C. Sequencing and Analysis of DNA Fragments in ChIP Products (Two Groups: Input and Experimental) | 35 | 10.Sequencing and Analysis Report |
Sample Requirements
Type | Sample Requirements | Shipping Conditions |
Gene synthesis or vector construction sequence required | None | None |
Constructed Plasmid | Concentration > 100 ng/μL, Volume > 20 μL; provide vector sequence and antibiotic resistance; no contamination. | Ice pack |
Bacterial Culture Containing Constructed Plasmid | Volume > 500 μL; provide vector sequence and antibiotic resistance; no contamination. | Dry ice, 1 day: 5 kg; 2–3 days: 10–20 kg; 3–5 days: 20–30 kg |
Bacterial Colony on Plate | No contamination | Room temperature |
Plant Sample | ≥4.5–6 g of fresh tissue, flash-frozen in liquid nitrogen | Dry ice 1 day: 5 kg; 2–3 days: 10–20 kg; 3–5 days: 20–30 kg |
Antibody | IP-grade antibody > 30 μL | Dry ice 1 day: 5 kg; 2–3 days: 10–20 kg; 3–5 days: 20–30 kg |
Case Results Studies
ChIP:
ChIP / Western Blot Results
According to the Western blot results, the bait protein was detected in both the input protein sample and the ChIP elution from the experimental group, but not in the control group. This is consistent with expectations and indicates that the ChIP experiment was successful.

ChIP-qPCR Analysis:
The enrichment of the A-DNA fragment in A antibody_ChIP was 2.5 times higher than in IgG_ChIP, indicating an interaction between protein A and the A gene DNA fragment.
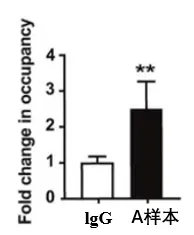
Figure: ChIP-qPCR Detection Results
ChIP-seq Analysis:
GO enrichment analysis, KEGG pathway enrichment analysis, and ReactomePA enrichment analysis of the annotated gene set.
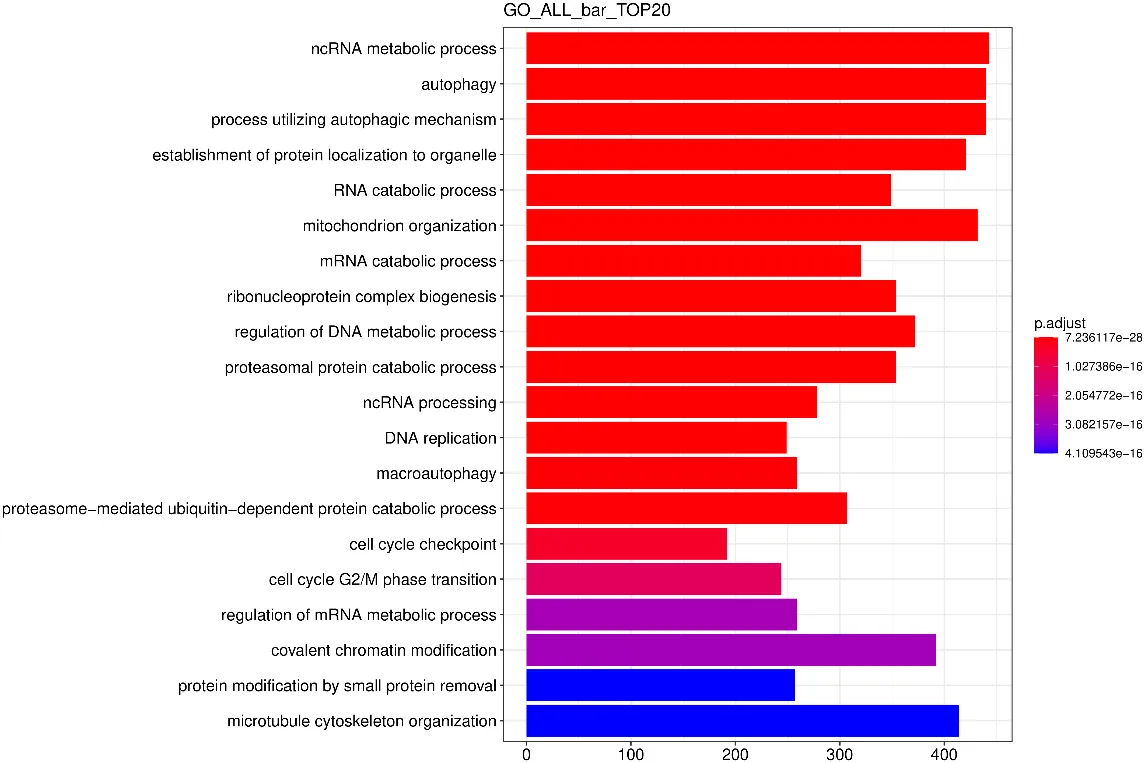
GO Enrichment Analysis Bar Chart
The vertical axis in the chart represents GO Terms, and the horizontal axis shows the significance level of GO Term enrichment—the higher the value, the more significant the enrichment.
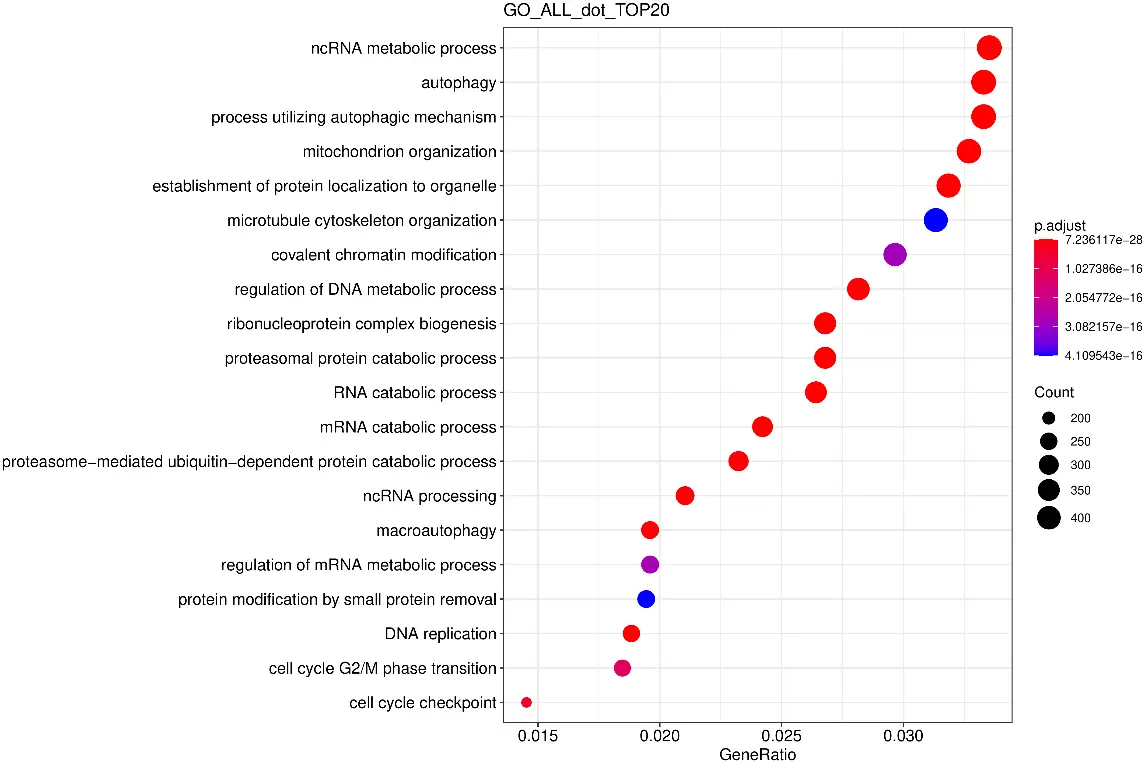
GO Enrichment Analysis Scatter Plot
The horizontal axis represents the ratio of differentially expressed genes annotated to the GO Term to the total number of differentially expressed genes, while the vertical axis represents the GO Terms.
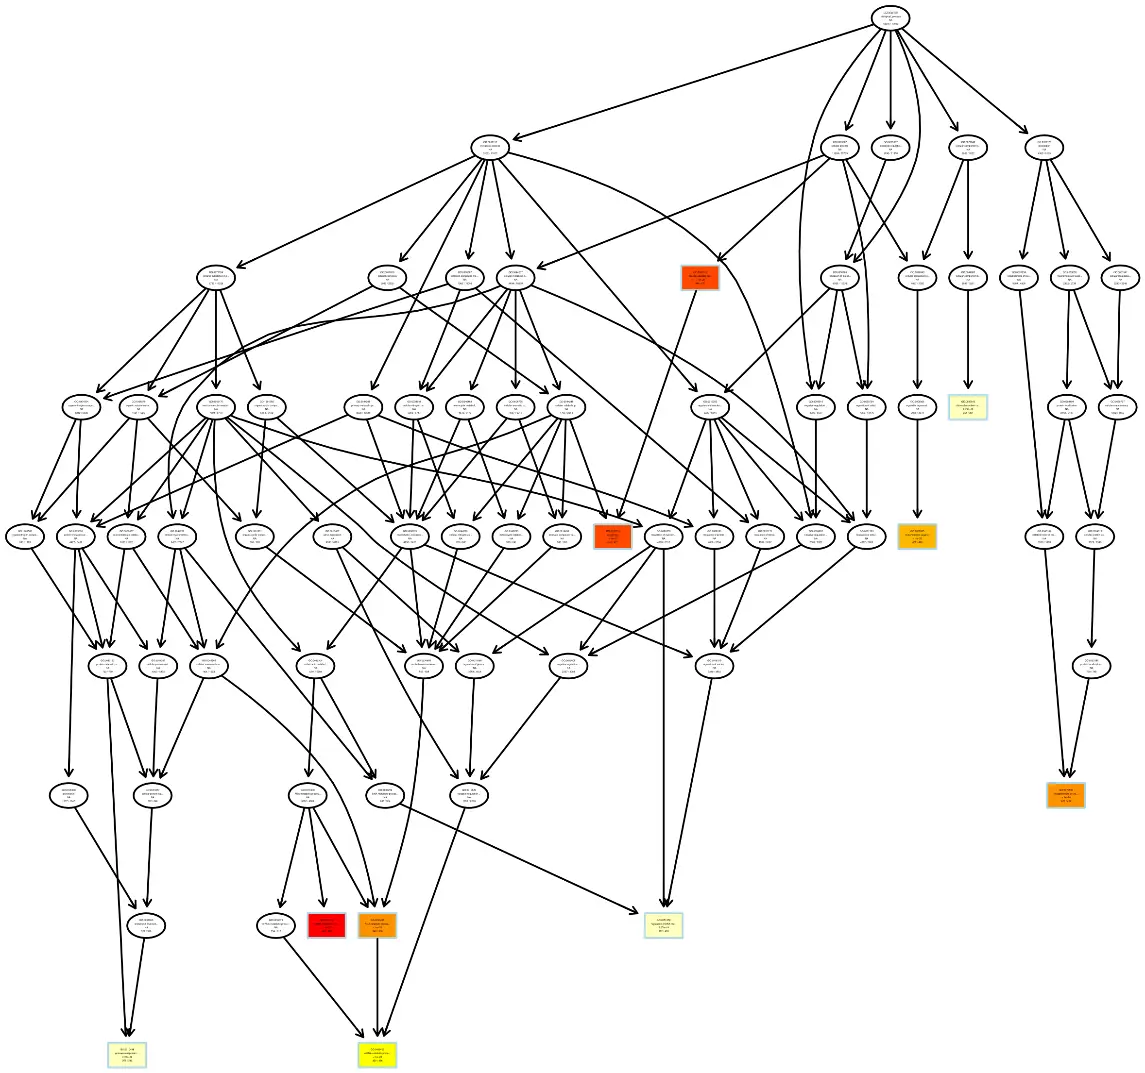
GO Enrichment Analysis DAG (Directed Acyclic Graph)
Each node represents a GO term. Boxes highlight the top 5 enriched GO terms. The color intensity indicates the enrichment level—the darker the color, the higher the enrichment. Each node displays the term name and the adjusted p-value (padj) from the enrichment analysis.
Motif Analysis of Peak Regions
Motif sequences in the peak regions were identified using Homer software. The identified motifs were then compared with the JASPAR database (JASPAR CORE 2016) to recognize known motifs.
Example of Homer results:

References:
[1]Jordn-Pla A, Visa N. Considerations on Experimental Design and Data Analysis of Chromatin Immunoprecipitation Experiments. Methods Mol Biol. 2018;1689:9-28.
[2] Tu X, Mejía-Guerra MK, Valdes Franco JA, et al. Reconstructing the maize leaf regulatory network using ChIP-seq data of 104 transcription factors. Nat Commun. 2020 Oct 9;11(1):5089.
[3] Zhao Y, Hu J, Wu J, Li Z. ChIP-seq profiling of H3K4me3 and H3K27me3 in an invasive insect, Bactroceradorsalis. Front Genet. 2023 Feb 23;14:1108104.
Statement: Services sold by our company are intended for research purposes only and must not be used for diagnostic or therapeutic purposes.
Services Workflow

Online Consultation
01

Solution Matching
02

Service Contract
03

One-Stop-Services
04

Project Report
05
Related Products
Product Inquiry

Contact Us

Tel: +86 025-85205672

Email: info@pronetbio.com

Address: Building 3C, Nanjing Xianlin Zhigu,
Qixia District, Nanjing, Jiangsu, China, 210033

Need more info?
Let's connect!


